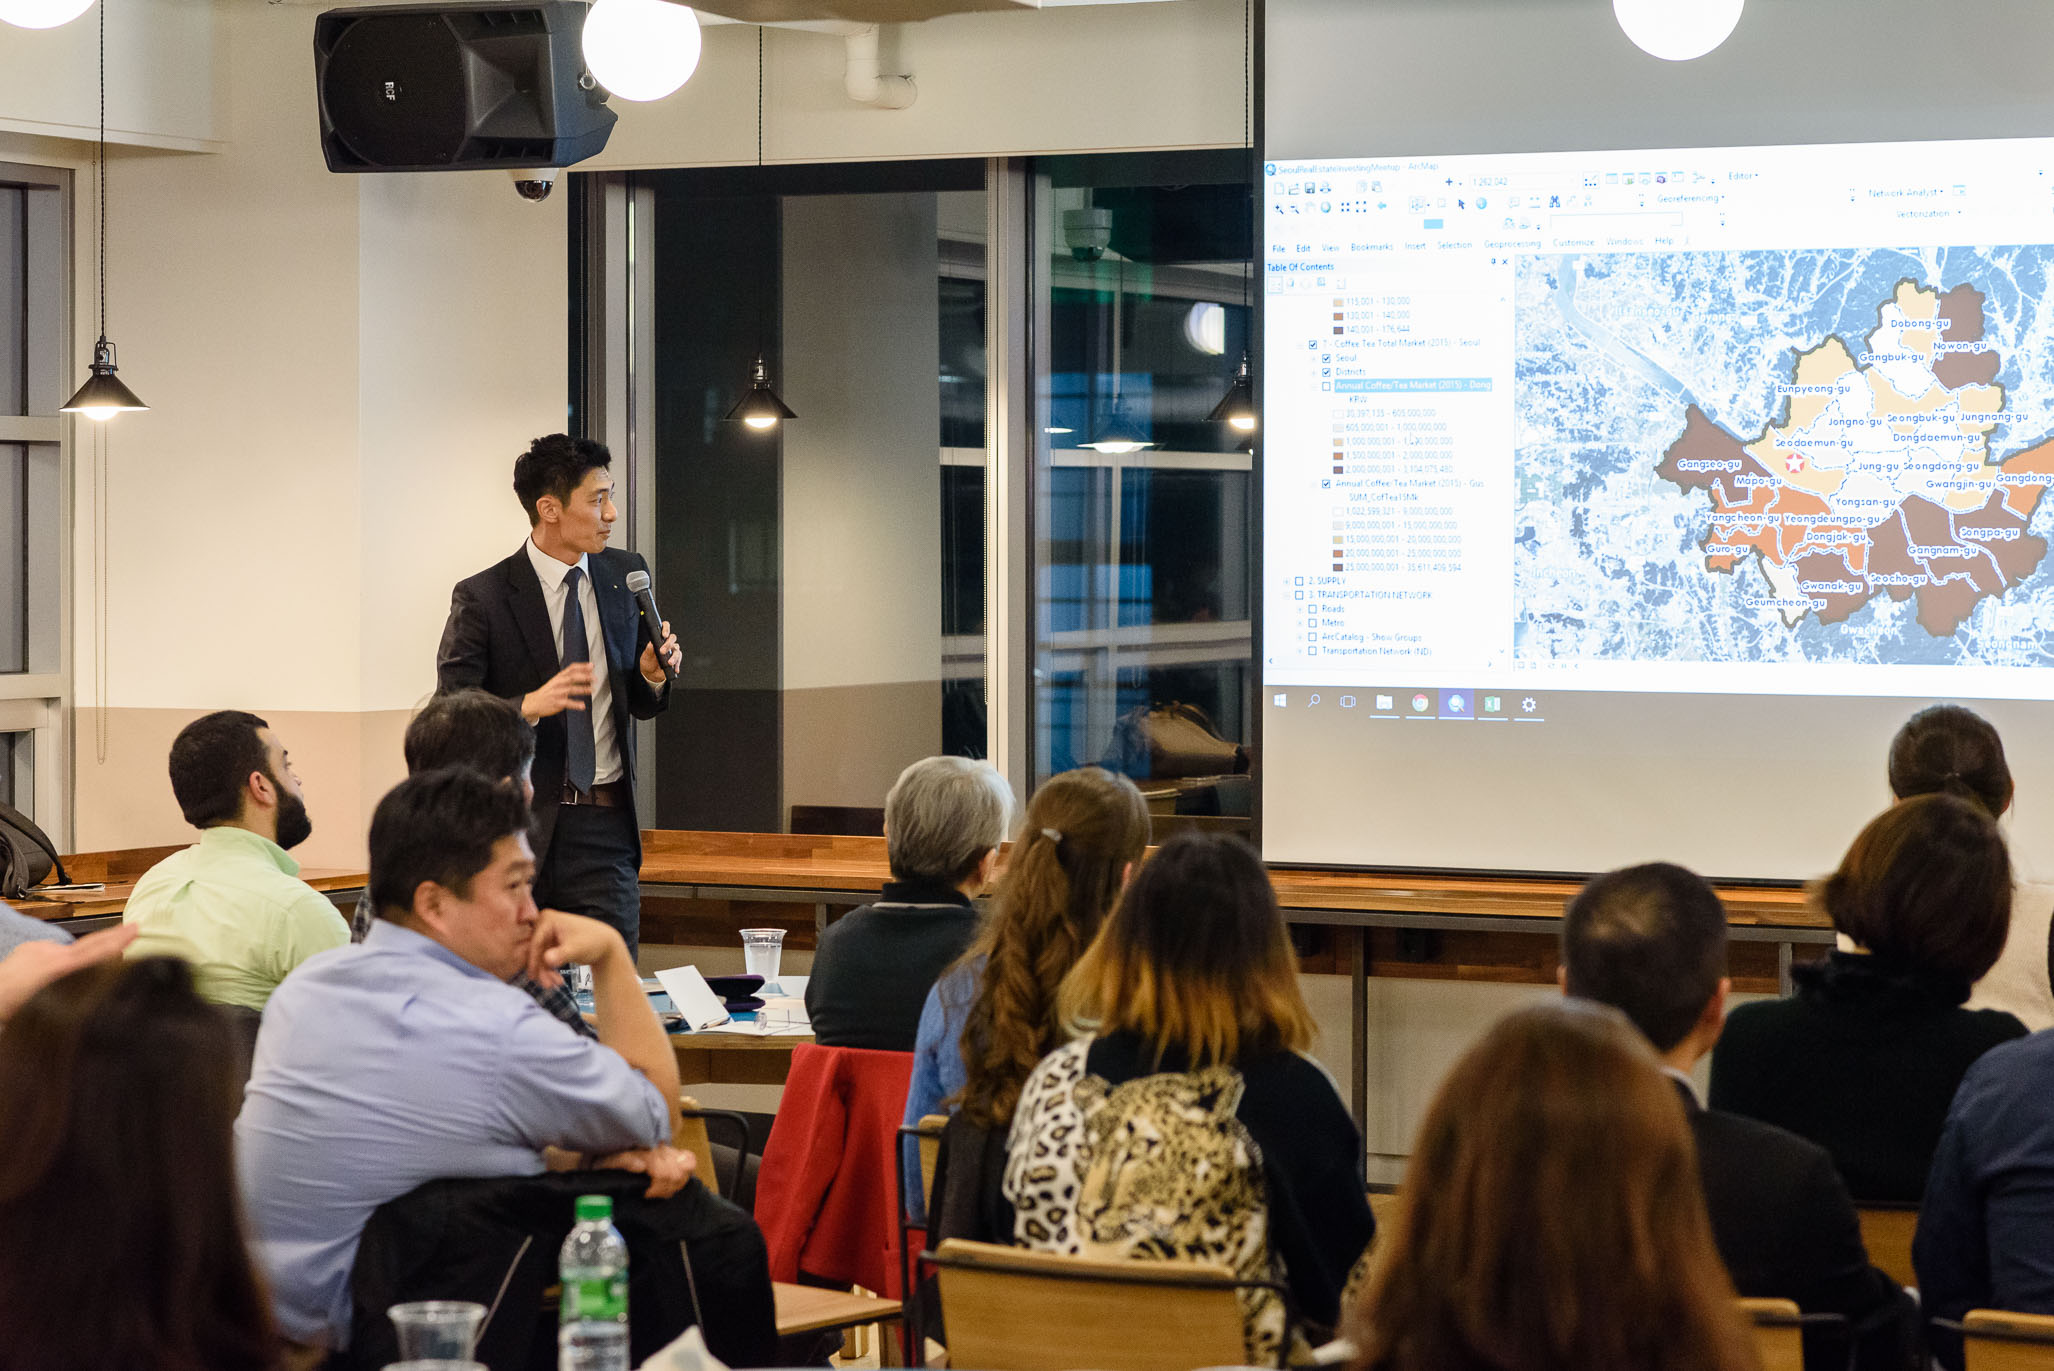
On November 17, the Seoul Real Estate Investing Meetup invited Raymond Chetti, an Urban Planner and Retail Market Analyst, to give a presentation entitled “Investing in Retail - GIS and Retail Market Analysis.”
The event was attended by approximately 75 community members and held at WeWork Gangnam Station, who sponsored the event by providing free craft beer and event space. Martin Bax, a professional interpreter, provided simultaneous English-to-Korean interpretation via a headset.
The Huff Model
In his presentation, Raymond used an adaptation of the Huff Model to determine the sales potential of a hypothetical coffee shop investment in Mangwon-dong, Mapo-gu. The basic premise of the model is that the closer to a person’s residence and the more attractive a retail development is, the higher the likelihood that he or she will visit that place.
One method of calculating the distance between two points is to draw a straight line between the two, disregarding geographical features (e.g., the Han river) and the transportation network. The second method is to account for the transportation network, he said.
Using the latter method, Raymond determined that IFC Mall is 27 minutes away by car for Dongdaemun-gu residents while Starfield Hanam is just an extra 10 minutes away.
However, given that Starfield Hanam is four times larger than IFC Mall, Dongdaemun-gu residents are more likely to shop at Starfield Hanam despite it being further away. He noted that where shopping malls are concerned, size is often a determining factor of attractiveness.
Supply, demand, and transportation
In the next part of his presentation, Raymond demonstrated how he uses ArcGIS to gather data and implement a comprehensive retail market analysis.
He looked at several factors including supply, demand, and Seoul’s transportation network. A number of data sources including the KOSIS (Korean Statistical Information Service), SGIS, the KTDB (Korea Transport Database), and other undisclosed sources were used to inform his analysis. As a GIS consultant, “you have to find all the data and put the pieces of the puzzle together… . You need to always be looking for data,” he said.
Supply was determined by the number of competitive coffee shops within a one-kilometer radius of the proposed café site. These were visualized on an interactive map with point features. Raymond found 173 cafés and, for the sake of illustration, assumed an attractiveness score of 100 for all coffee shops. Selecting a supply point would display the coffee shop’s name, address, and probability of sales.
Demand was calculated by importing census data from the KOSIS into ArcGIS to create interactive graduated color maps. This included both macro and micro data about population, number of households, household growth, average income, and spending per household. To get a more accurate picture of the population distribution within individual neighborhoods, population density map images from SGIS were georeferenced in ArcGIS.
Spending on coffee and tea was calculated by taking an aggregate of spending per household multiplied by the number of households in the coffee shop’s catchment area.
Raymond’s analysis of the transportation network took into account both the road and metro system, for which information was sourced from the KTDB. This included the maximum speed of all subway lines and major roads in the city. Raymond assumed that roads not indexed on the KTDB are smaller roads with maximum speed limits of 15 or 25 kilometers per hour.
Newly planned subway lines and extensions were also included in the analysis.
Once Raymond had collected all of the necessary data about supply, demand, and the transportation network, he used the merge tool in ArcGIS to combine these datasets into a single dataset. He was then able to calculate the probability of sales for the coffee shop in question.
Raymond concluded his presentation by showing investors how Esri Story Maps may be used to pitch such retails investments to potential investors in a visually attractive way.
If you are interested in working with Raymond Chetti, please email him at raychetti@gmail.com.

